


What’s Changing on the New Rico aos Poucos Website?
Almost everything that matters. The new version features a redesigned homepage, a real estate fund analysis engine rebuilt from scratch, proprietary ratings for asset managers, and an asset guide featuring short-form video lessons. The launch is scheduled for between the end of this week and early next week.
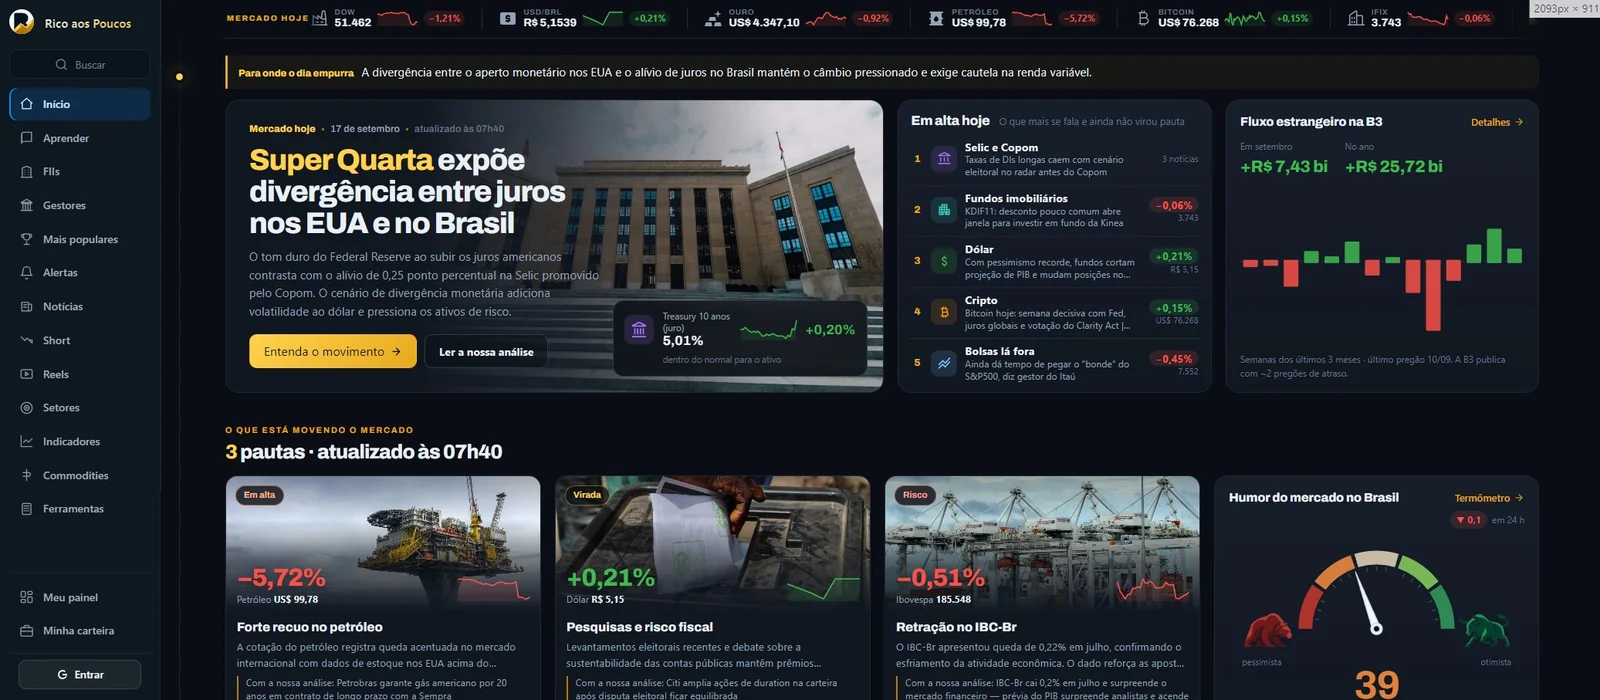
The most noticeable upgrade happens on desktop computers. The current version was designed primarily for mobile use, which left desktop screens with wasted space and stretched cards. The new layout uses the extra width to display more information simultaneously—but the real change isn't visual. It happens behind the numbers.
A Homepage Built for Daily Readers
The homepage has shifted from an article showcase to a daily market dashboard. Upon opening the site, users will immediately see:
- Market Today: the day’s main topic, explained clearly, alongside the key driver (such as U.S. interest rates) and a direct link to our analysis;
- Trending Today: the five topics generating the most buzz among Brazilian investors on that day;
- Foreign Flow on B3: net foreign capital inflows or outflows from the stock exchange for the month and year;
- Market Movers: the day’s leading headlines, each linked to the specific asset it affects—oil, the U.S. dollar, or the Ibovespa;
- Market Sentiment: a 0-to-100 gauge tracking sentiment across the press, YouTube, and social media;
- a fixed ticker displaying key benchmarks: the Dow Jones, the U.S. dollar, gold, oil, Bitcoin, and the IFIX.
The concept is simple: in under a minute, you know what happened, why it happened, and where to read more.
The Real Estate Fund Analysis Engine Was Rebuilt from Scratch
This was the most demanding upgrade—and the one that fundamentally changes what you will find on each fund's page.
The new engine reads every document the fund has submitted to the CVM in chronological order: managerial reports, monthly disclosures, and material facts. Every figure is mapped back to its source—identifying the exact document and month it came from. As a result, the page no longer just shows a snapshot of today; it illustrates how the fund reached its current position month by month, and where its distributions originate.
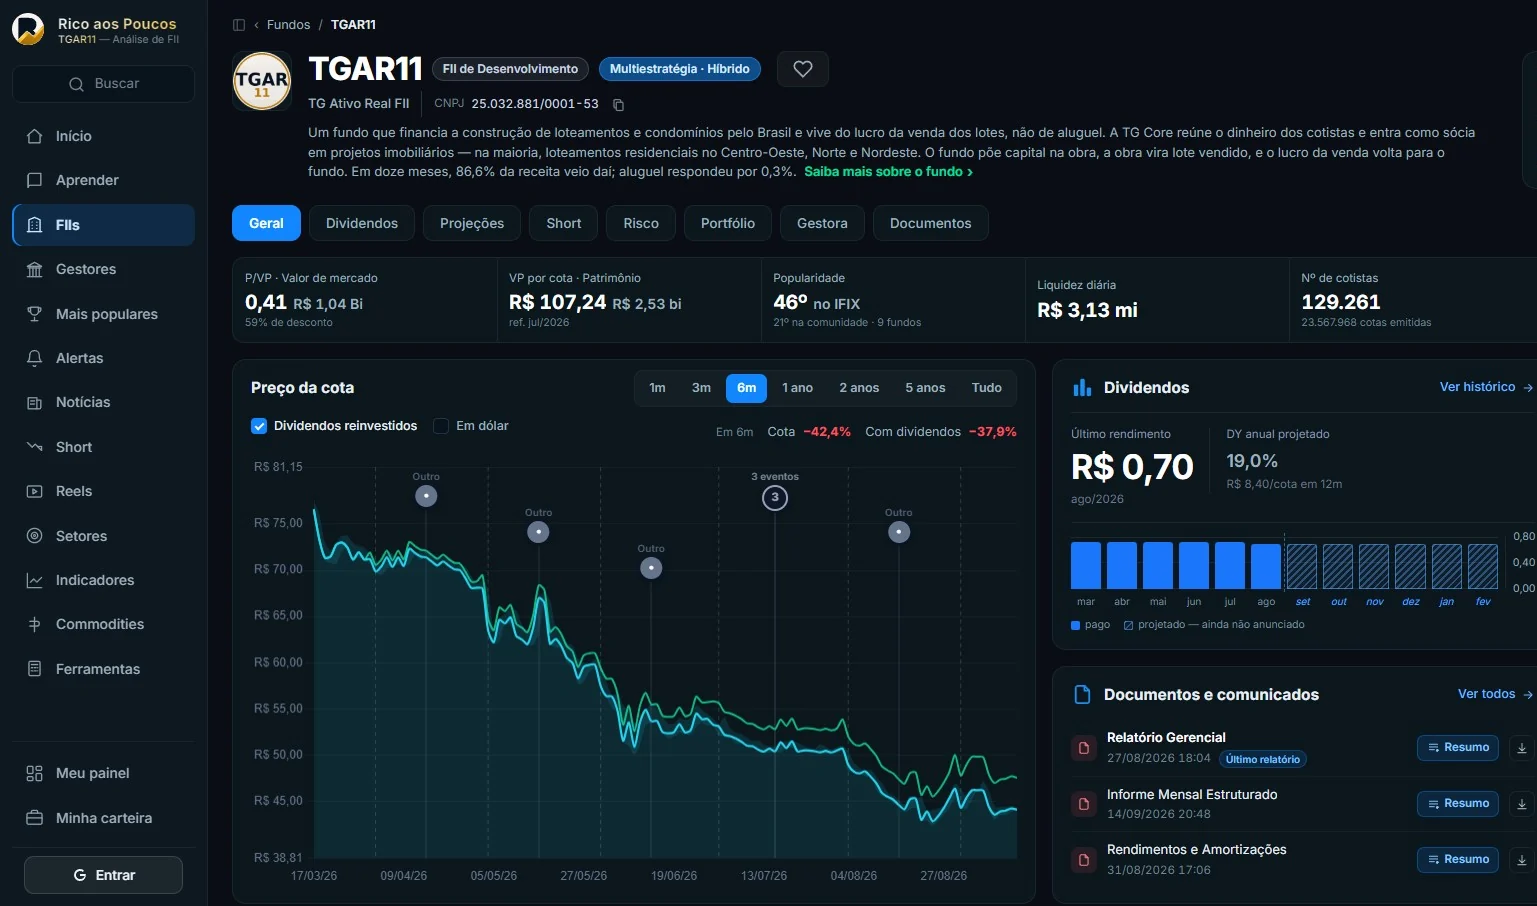
This foundation powers four significantly improved features:
- Distribution Projections: an estimate of what the fund should distribute in the coming months, calculated from its actual cash generation rather than the payout chosen by the manager in the most recent month;
- Fair Value and Unit Price Projections: fair value is derived using independent methods, accompanied by a performance track record. The chart displays what the model predicted at various points in the past versus what actually happened;
- 0-to-10 Rating: measures fund quality—distribution stability, returns to unitholders, management, risk, and financial strength. Unit price is excluded from the score, ensuring the rating doesn't rise simply because the unit price dropped;
- Model Portfolios: constructed using this comprehensive data, aligning them more closely with the underlying metrics.
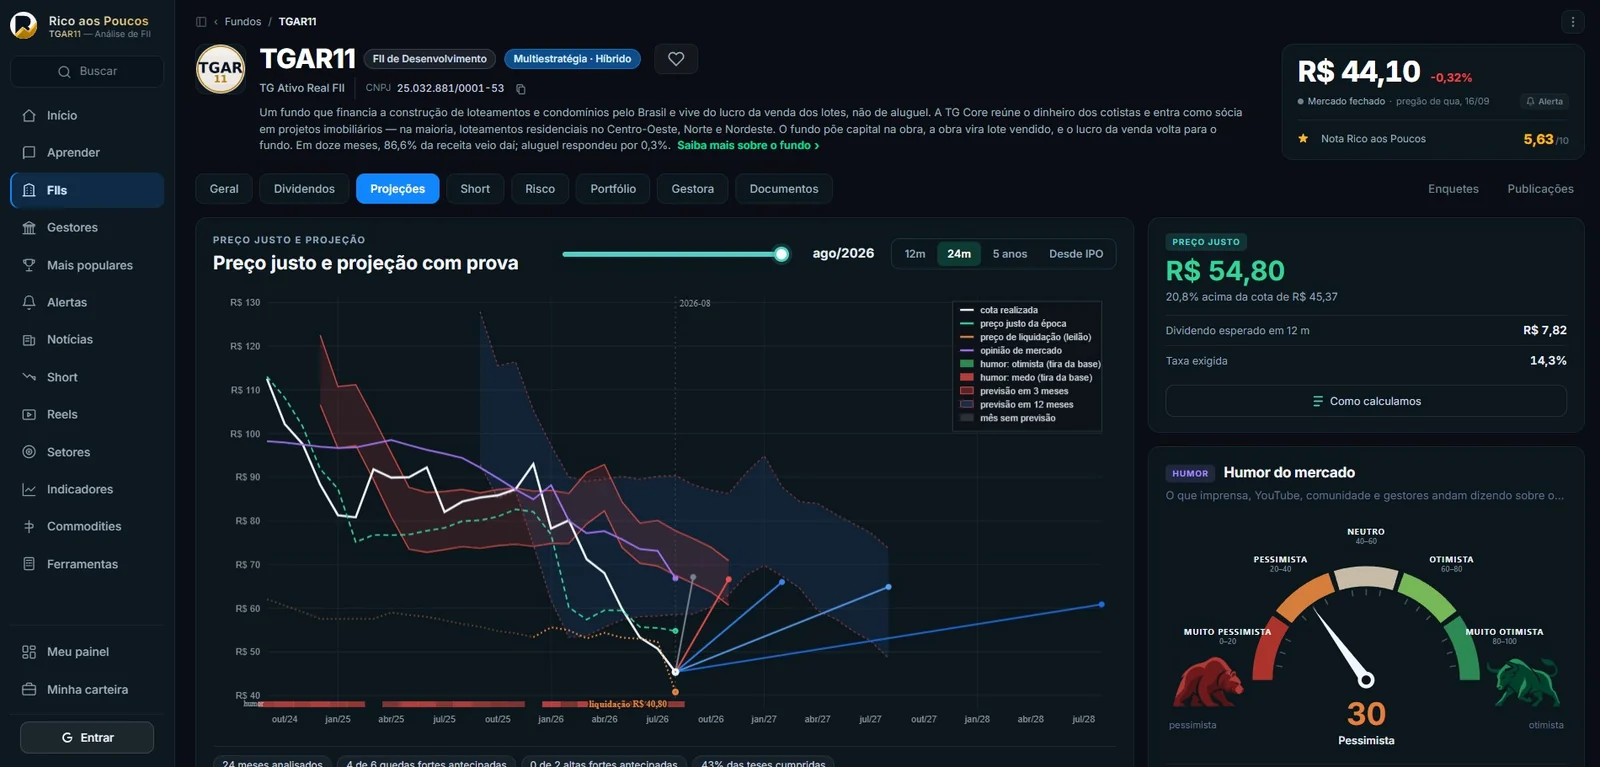
Why highlight both hits and misses? A projection that never shows its past accuracy asks you to trust it blindly. In the new Projections tab, each fund displays the model's scorecard: how many significant pullbacks were anticipated, how many rallies, and how many investment theses played out. You decide how much weight to give it.
Portfolios Organized by Your Goals
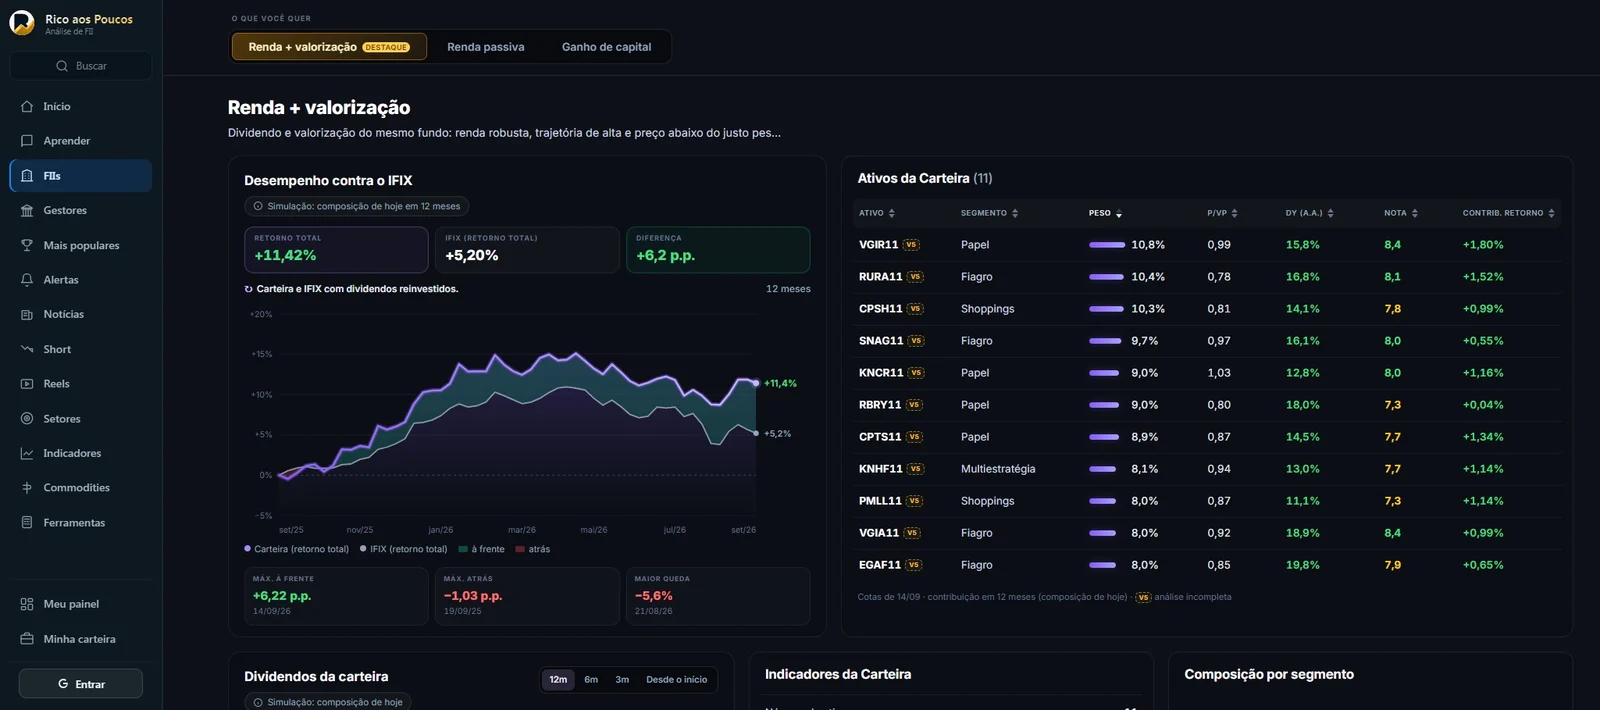
Recommended REIT portfolios are now organized by investment objective—Income + Growth, Passive Income, or Capital Gains. Each portfolio highlights its performance relative to the IFIX since inception, its greatest advantage, its greatest disadvantage, and its maximum drawdown. In the table, each fund displays its asset sector, portfolio weight, price-to-book ratio, dividend yield, rating, and return contribution.
Asset Managers Are Half the Decision—Yet Almost No One Analyzes Them
When you buy units in a real estate fund, you entrust your capital to an external team. The manager decides what to buy, when to sell, how much to pay for a property or a real estate credit note (CRI), whether to issue new units, and at what price. Two funds with identical strategies can experience vastly different outcomes solely because of who is running them. Even so, most unitholders select funds based solely on dividend yield and never visit the asset manager's page.
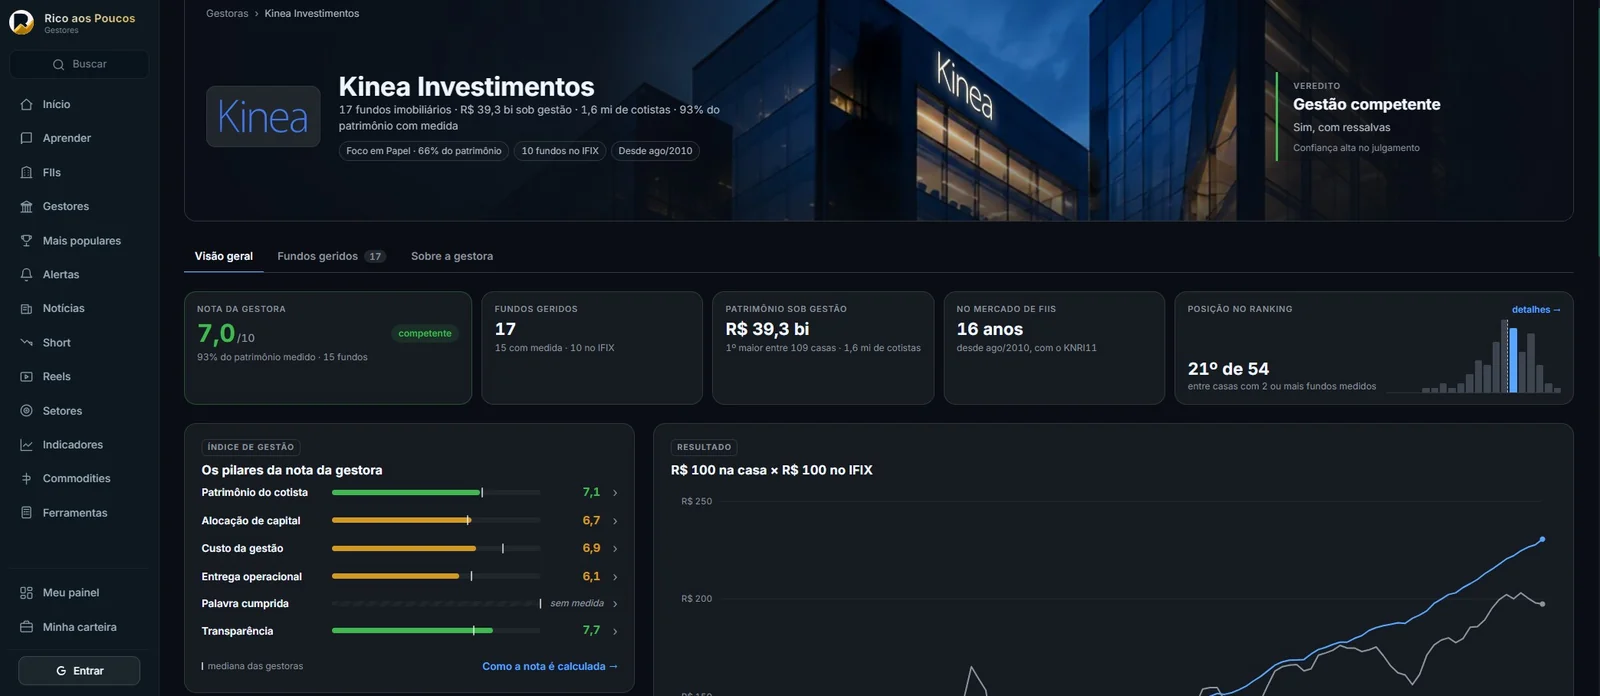
In the new version, every asset manager has a dedicated page complete with a rating and verdict. The score is broken down across six pillars:
- Unitholder Wealth: has the net asset value per unit been preserved over time?
- Capital Allocation: have acquisitions and disposals created or destroyed value?
- Management Costs: how much revenue is retained by the manager?
- Operational Delivery: vacancy rates, default rates, and asset performance;
- Promises Kept: did the manager follow through on what was promised in reports?
- Transparency: how clearly the manager explains its actions.
It also features a direct performance comparison answering a fundamental question: R$ 100 invested in that firm's funds versus R$ 100 in the IFIX.
The Conflict of Interest Map
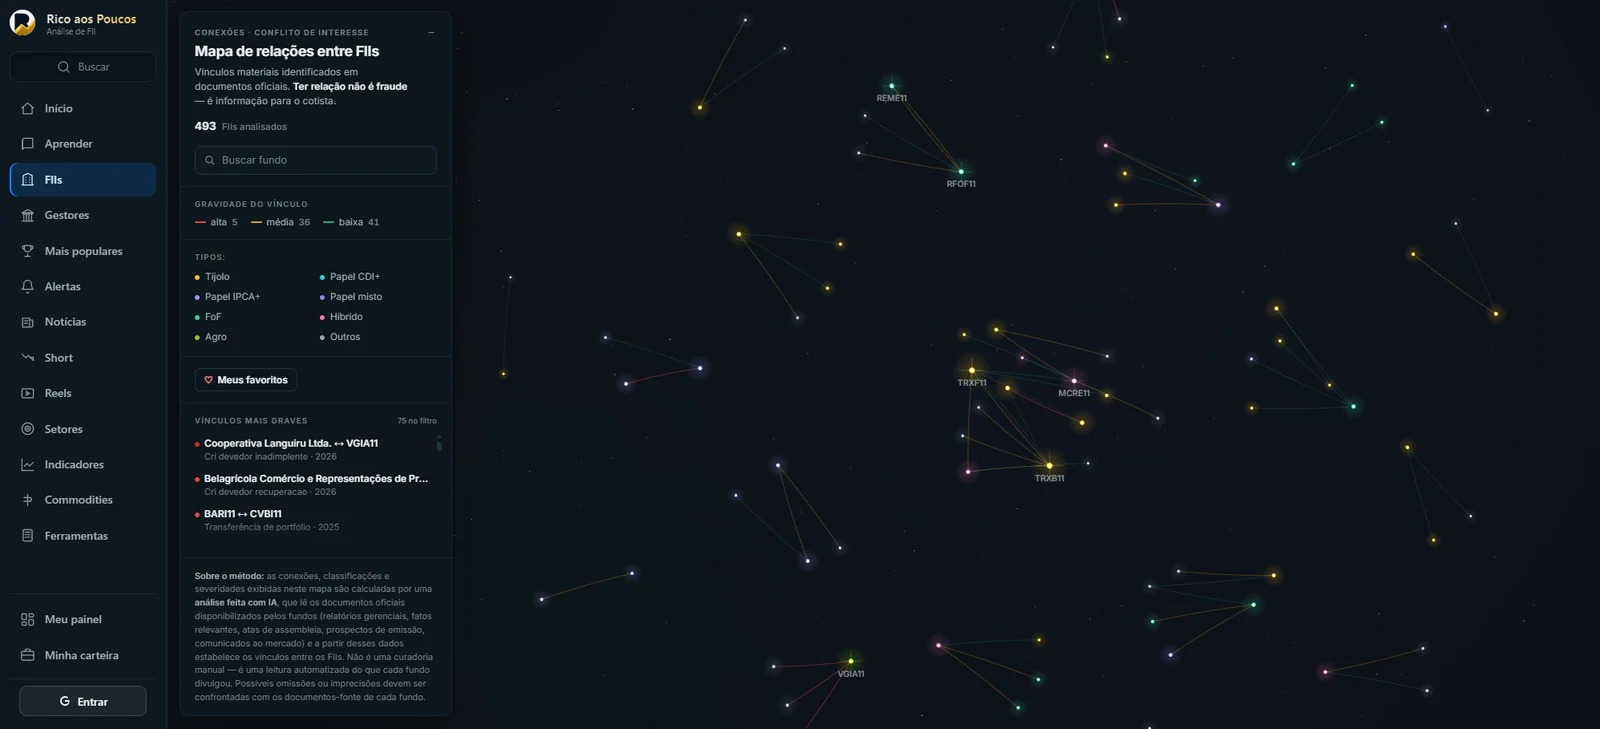
Funds managed by the same firm frequently buy units from one another, transfer portfolios internally, and lend to the same borrowers. While this isn't always problematic, unitholders need visibility into these relationships. The new REIT relationship map cross-references tracked funds and highlights connections by risk severity: portfolio transfers between funds, CRIs tied to debtors undergoing judicial reorganization, and defaulting debtors present across multiple funds.
Asset Guide: Short Video Lessons from Beginner to Advanced
Alongside the new website comes the Asset Guide: learning tracks organized by asset class—REITs, stocks, fixed income, ETFs, crypto, commodities, foreign exchange, and offshore equities—delivered via Reels-style lessons. These concise, narrated videos are easy to watch during a busy day. The real estate fund track is the first and most comprehensive, featuring 60 lessons.

This track was developed to answer the critical questions most investors fail to ask before buying their first unit—questions that ultimately make all the difference:
- What am I actually buying? A fraction of a property, a debt instrument, or units in other funds?
- Who is in charge of the fund? What is the difference between an investment manager and an administrator, and who is accountable?
- What are my rights as a unitholder? What decisions are made at unitholder meetings, and what is my vote worth?
- What can and can't the manager do? Can they sell a property below its appraisal value? Can they alter the fund's strategy? Can they halt distributions?
- Is it actually safe? What protections exist for unitholders when management acts against their interests—and where do those protections end?
These fundamentals are often overlooked, yet many enter the market without ever pausing to ask them. The beginner-level content is open to everyone, with no registration required.
And a Few More Surprises
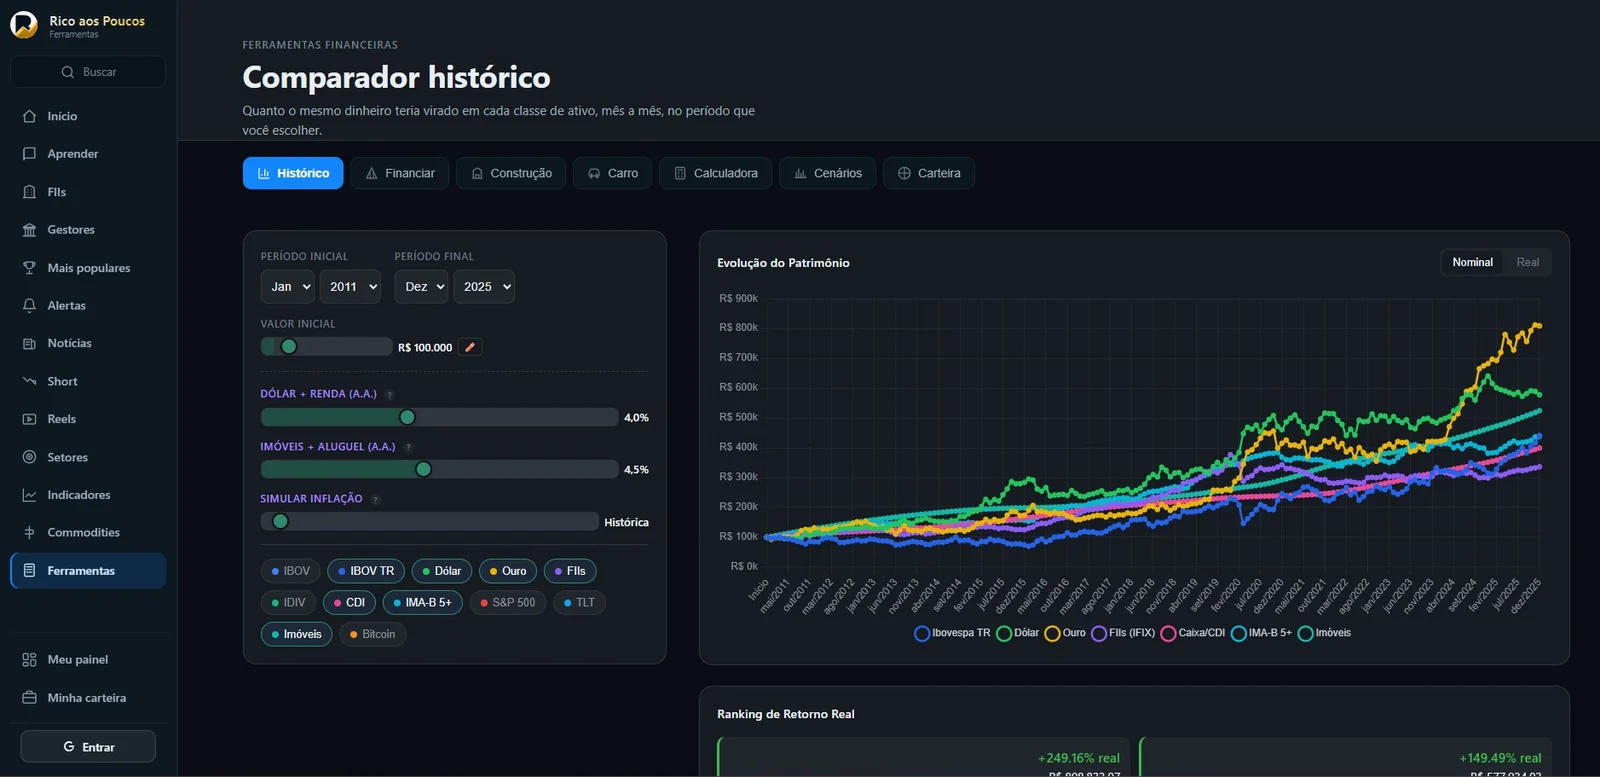
The historical comparative tool addresses a question every investor asks: if I had invested R$ 100,000 in 2011, what would it be worth today across different asset classes? It plots the Ibovespa, the U.S. dollar, gold, REITs, the CDI, the IMA-B, the S&P 500, physical real estate, and Bitcoin on a single chart, month by month, in nominal terms or adjusted for inflation.
Additionally, each fund page now includes a unitholder chat feature directly within its analysis page, allowing users to exchange insights with fellow investors tracking the same asset.
When is the launch? The rollout is planned for between the end of this week and early next week. The web address remains the same, and your account, portfolio, and saved favorites will stay right where they are—on launch day, simply open the site.
Until then, it’s a good time to jot down your questions: which manager runs your fund, where its distributions come from, and what the projections indicate for the months ahead. Next week, those answers will be just a click away.